Monday, 12 October 2015

To check how frequently the Database table is accessed in SQL Database Server

Hi All,
Being a Database expert or Monitoring the database or working on Data warehouse Project frequently we come across the scenario where query gets delayed, performance hampered etc.


So we can have some logical checks on the database by using the below query.


SELECT
  t.name AS 'Table',
  SUM(i.user_seeks + i.user_scans + i.user_lookups)
    AS 'Total accesses',
  SUM(i.user_seeks) AS 'Seeks',
  SUM(i.user_scans) AS 'Scans',
  SUM(i.user_lookups) AS 'Lookups'
FROM
  sys.dm_db_index_usage_stats i RIGHT OUTER JOIN
    sys.tables t ON (t.object_id = i.object_id)
GROUP BY
  i.object_id,
  t.name
ORDER BY [Total accesses] DESC


This will give you the below result


It will help you to build your indexes, monitor the much hitting tables and responsible for proper Database management.


Thanks & Regards
Mayur

Sunday, 9 December 2012

How to implement Clock (Digital Clock) On Xcelsius Dashboard


It is often found that client demands for various functionality on Xcelsius Dashboard one among that was want to show the dynamic (Continuously) running Clock

Component:
               Label Component 
               Play Selector
                      Background (Optional  to display Proper)

    Note That: 
      
      In excel has the functionality of displaying the current Date & Time using the function “NOW” But in case of displaying the continuous (running) clock that function is not sufficient enough because the cell in   which that function is placed is not Triggered or Refreshed at regular instance hence we need to do some    work around using the Xcelsius Component Like Play Selector.


Steps 1:
Create three Sections on Excel for
    
       1)      Current time (To be display on dashboard)
             2)      Source For Play Selector
             3)      Destination For Play Selector


 Step 2:

Play Sector Setting

In the general Tab of Play Sector Properties Select “Insertion Type” as “Row
Allocate two cells for source & Destination as shown in figure below:


In the cell where you have placed the source of the play selector has the logic as selecting destination cell + 1 (e.g.  C4+1 where C4 is the cell which has play selector destination) you can place 1, 2, 3..its just an reference value  but remember that it should not be 0 

Step 3:

In the Behavior Tab of the Play sector we need to set the Interaction Option properties as

Play Time (Second):  1 

Auto Play: Yes

Auto Rewind: Yes

Auto Replay: Yes

As shown in below figure 


Now as we set the interaction option’s Play time as one second it will dynamically trigger the cell at regular intervals and as a result the function “NOW” is trigger at regular interval (Every Second.)


Step 4:

After applying all the above properties you have to create logic/formulas for triggering   

Cell next to Current Local Time has the following Formula as:

If (Cell next to destination   >0 then now () else now ()) i.e. if(c4>0,now(),now())

Explanation of above formula: in this scenario any how we have to display the value of function “NOW” so we had used the function “NOW” twice and for checking the value greater than zero is just to let the cell check the formula (if) at regular interval (Every 1 Second) in short it is to fool the system to check for zero as we already kept that cell (cell next to destination) blank.


Cell next to Source has following formula as:

Cell next to destination + 1 (either   1, 2, 3 but should not be 0) i.e. c4+1

Explanation of above formula every time to trigger cell we need to add the value to the respective cell

Cell next to Destination as:

Explanation of above formula  Keep the cell blank.


Monday, 3 September 2012

Tool Tips In Xcelsius Dashboard

Tool Tips In Xcelsius Dashboard

Step 1:
Note: The Component which has Interaction Option with Insert On: Option is Ideal for implementing the tool tips.


Select the component on which you want to implement Tool Tip here we have consider Label Based Menu, Fisheye Menu, Sliding Menu.


Step 2:
Create Message or Information which you want to display i.e. an tool tip window on Canvas
Here we had consider Components like Background, Label & Canvas


Step 3:
Case 1: Label Based Menu
Go into the properties of label based menu and insert the Label Values (Here Label1, Label2, Label3….)

In the Properties window of Label Based Menu put Insertion Type as POSITION and assign the cell as shown in the fig as a destination 


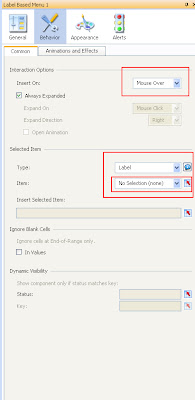
In the behavior Properties of the Label Based Menu, in the Interaction Option select Insertion On: Mouse Over and selected item Type as Label and Item as No Selection (none).


Step 4:
Assign the Dynamic Visibility to the tool tip Window i.e. Complete Canvas.
 In the Canvas Property Select Common Properties assign the Status as the cell (Which was the destination of the Label Based Menu) and Key as 1 (1 because it’s your first tooltip which you want to display on selection i.e. Mouse Over of label Based Menu.) For the next label’s tool tip you must assign the second Canvas Dynamic Visibility as Properties as Status as the cell (Which was the destination of the Label Based Menu) and Key as 2 and so on for the next Labels  


 Step 5:
Repeat the step 1 to 4 for the other components. Following is the screen shots for the Fisheye Picture Menu component.


Tuesday, 27 March 2012

Adding loading GIF Image/Adding loading message to your Xcelsius Dashboard.


Initially create your live office or QAWS connections
(Here Qaws-connections)

1)    Add the Query as Web Services Connections.
2)    Add the URL
3)    Import the URL


4)    Select the Usage Tab in the connections
5)    Set your loading message (here Loading)
6)    Set your Idle message (here Ideal)  
7)    Give a Reference cell to an Insert In option (this reference cell is later on used for dynamic visibility of the image component which is used to display the loading message). 

8)    Add the image component 

9)    Go to behavior tab of the image component.
10)    Set the Status to the reference cell which we had specified in the usage tab of qaws connections for the “Insert In:” option. 


11)    Set the key same as that we had specified in the “Loading Message” section of the usage tab in qaws connections.

12)    At the end your qaws is trigger by some component like calendar, buttons, labels etc. hence you will see the loading image will appeared whenever there is some time (delay) require to fetch data from universe(backend).

13)    For the loading message you can take label (etc components) and put your message over it and apply the same dynamic visibility as did for the above Case. 


Wednesday, 21 March 2012

Sending Range of data from one Dashboard to another using Flash Variable in Xcelsius


Requirement:

(A Case Study)

“There is the hierarchy structure of an organization on each level. Based on the level selected, dashboard (which contain entire data, but expected that restricted data based on level selected should open) should open. 
Diagrammatical Representation:


STEPS

Step1: create the Child Dashboard which will be opened on selecting particular level

Step1.1:
            Based on the design create your dashboard (here I had consider simple scenario like dashboard with 5 combo box, because whatever you select in parent dashboard it should pass that value in child dashboard in the respective combo box)


In data insertion
Select Insertion type as “VALUE


Here we had consider the blank cell because there is scenario like optional prompts in which we can or we may not pass the value the value to component (consider this scenario when there is optional prompt coming from query as a web services(QAWS) or from live office (LO)

Steps1.2:
Create the flash variable which will accept the values from the parent dashboard


Steps1.3:
Create the excel logic


In this excel PG (below entries) is the label for the first combo box and index (2, 3, 4) here we had considered the index from 2 not from 1 because if from the parent dashboard none is selected then it should show the label as All.
Step1.4:
Building the vlookup logic in-order to retrieve the index value of respective group (here PG, SG, G, O, BU) which is later to position the combo box. 


 Step 1.5:
Building the position logic for the combo box position parameters:


Step 1.6:
Now the child dashboard is completed now export it to the Info-view:


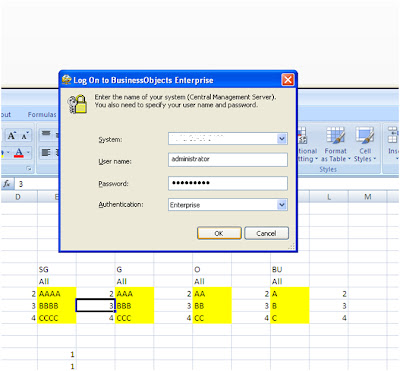
Enter the credentials


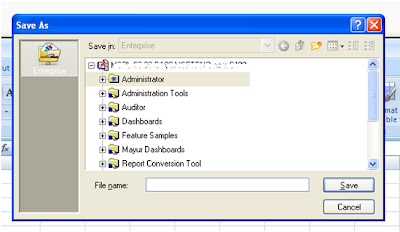
Save it to desire folder you want


 Step 2:
Create the Parent dashboard
Create the hierarchy structure as per requirement in this scenario .we had consider the combo box  but you can select any structure( if you consider the fixed structure then you need to make more number of url for the display of child dashboard which will be explained at the end of this case study)

Step 2.1:
Creating the parent dashboard structure:


Give the label range 


Select data insertion type as “Row


Do remember to place the destination properly


Similarly for the other combo box place next to the current destination selected

Create Flash Variable Syntax to pass data to the child dashboard
Consider two scenarios:
1)    Child dashboard store in server (infoview)
2)    Child dashboard store on local server (own machine)

Scenario 1) Child Dashboard Store in Server (infoview)

 Range Name:

&lsSPG
Here I added “ &lsS” as a prefix to “PG” (where PG the name of the range we had considered while designing the child dashboard in flash variable connections) because it’s the variable we are using in the open doc statement and open doc url  had standard syntax for accepting the single value .

Code:
AAAAA     AAAA    AAA    AA   A (selected values in parent dashboard present in different cells)


Syntax for Flash Variable:

(URL&”?”&Range Name&”=”&Code)

=K9&"?"&K10&"="&K13&","&L13&","&M13&","&N13&","&O13 (in above scenario)
In the above syntax data is separated by commas if there are multiple values selected


Scenario 2) Child dashboard store on local server (own machine)

URL:
C:\Documents and Settings\User\Desktop\Folder Name\FLASH VARIABLE_TRAILS\Dummy_Child.swf
(Place SWF wherever you want in your system & get the path)
Range Name:
PG (Here no need of adding &lsS before PG because file is not access through the open doc URL)

Code:
AAAAA     AAAA    AAA    AA   A (selected values in parent dashboard present in different cells)

Syntax for Flash Variable:

(URL&”?”&Range Name&”=”&Code)
 =K8&"?"&K10&"="&K13&","&L13&","&M13&","&N13&","&O13
In the above syntax data is separated by commas if there are multiple values selected


Result:
Parent Dashboard


Enter Credentials:
(If your parent dashboard is exported to server and you are viewing through infoview than you don’t need to enter the credentials as your user is configured with proper privileges)  


 View dashboard


When multiple entries are selected


Output:


……………………

From the above logic you can implement whatever you want for examples
Instead of using combo box at each level you can use fixed labels for that you need to make multiple OpenDoc URL for each level and pass the variable in same manner as explained above and open the child dashboard using the URL button & many more ideas you can implement in your Dashboard.


Thanks & Regards
Mayur Patil