Requirement:
(A Case Study)
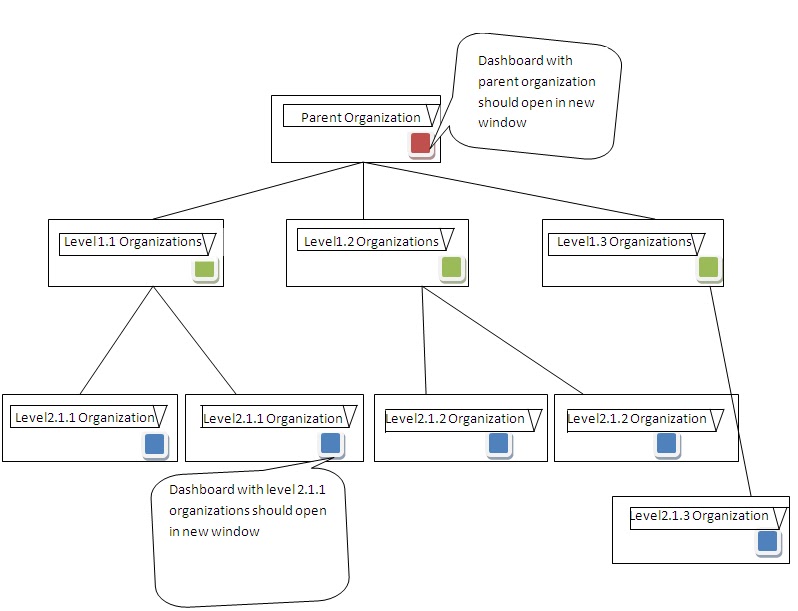
“There is the hierarchy structure of an organization on each level.
Based on the level selected, dashboard (which contain entire data, but
expected that restricted data based on level selected should open) should
open.
Diagrammatical
Representation:
STEPS
Step1:
create the Child Dashboard which will be opened on selecting particular level
Step1.1:
Based on the design create your
dashboard (here I had consider simple scenario like dashboard with 5 combo box,
because whatever you select in parent dashboard it should pass that value in
child dashboard in the respective combo box)
In data
insertion
Select
Insertion type as “VALUE”
Here we had
consider the blank cell because there is scenario like optional prompts in
which we can or we may not pass the value the value to component (consider this
scenario when there is optional prompt coming from query as a web
services(QAWS) or from live office (LO)
Steps1.2:
Create the
flash variable which will accept the values from the parent dashboard
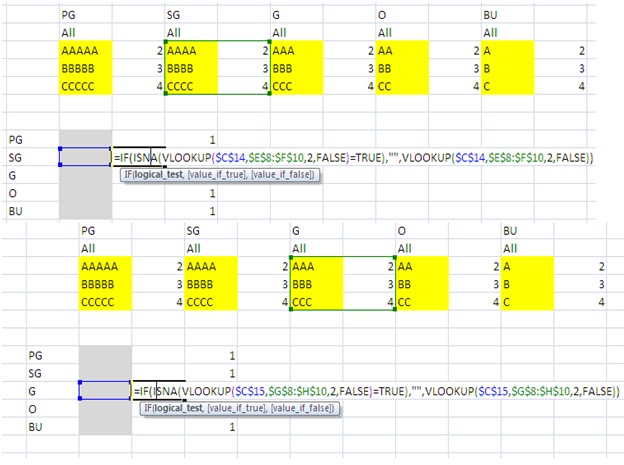
Steps1.3:
Create the
excel logic
In this
excel PG (below entries) is the label for the first combo box and index (2, 3,
4) here we had considered the index from 2 not from 1 because if from the
parent dashboard none is selected then it should show the label as All.
Step1.4:
Building the vlookup logic in-order to retrieve
the index value of respective group (here PG, SG, G, O, BU) which is later to
position the combo box.
Step 1.5:
Building the
position logic for the combo box position parameters:
Step 1.6:
Now the
child dashboard is completed now export it to the Info-view:
Enter the
credentials
Save it to
desire folder you want
Step 2:
Create the
Parent dashboard
Create the
hierarchy structure as per requirement in this scenario .we had consider the
combo box but you can select any
structure( if you consider the fixed structure then you need to make more number
of url for the display of child dashboard which will be explained at the end of
this case study)
Step 2.1:
Creating the
parent dashboard structure:
Give
the label range
Select data
insertion type as “Row”
Do remember
to place the destination properly
Similarly
for the other combo box place next to the current destination selected
Create
Flash Variable Syntax to pass data to the child dashboard
Consider
two scenarios:
1)
Child
dashboard store in server (infoview)
2)
Child
dashboard store on local server (own machine)
Scenario 1) Child Dashboard Store in
Server (infoview)
Range Name:
&lsSPG
Here I added “ &lsS” as a prefix to “PG” (where PG the name of the range we had considered while designing
the child dashboard in flash variable connections)
because it’s the variable we are using in the open doc statement and open doc
url had standard syntax for accepting
the single value .
Code:
AAAAA AAAA
AAA AA A (selected values in parent dashboard present
in different cells)
Syntax for Flash Variable:
(URL&”?”&Range
Name&”=”&Code)
=K9&"?"&K10&"="&K13&","&L13&","&M13&","&N13&","&O13
(in above scenario)
In the above syntax data is separated
by commas if there are multiple values selected
Scenario 2) Child dashboard store on local server (own
machine)
URL:
C:\Documents and Settings\User\Desktop\Folder Name\FLASH
VARIABLE_TRAILS\Dummy_Child.swf
(Place SWF wherever you want in your system & get the
path)
Range Name:
PG (Here no need of adding &lsS before PG because file is not access through the open doc URL)
Code:
AAAAA AAAA AAA
AA A (selected values in parent
dashboard present in different cells)
Syntax for Flash Variable:
(URL&”?”&Range
Name&”=”&Code)
=K8&"?"&K10&"="&K13&","&L13&","&M13&","&N13&","&O13
In the above syntax data is separated by commas if there are
multiple values selected
Result:
Parent Dashboard
Enter Credentials:
(If your parent dashboard is exported to server
and you are viewing through infoview than you don’t need to enter the credentials
as your user is configured with proper privileges)
View dashboard
When multiple entries are selected
Output:
……………………
From the above logic you can
implement whatever you want for examples
Instead
of using combo box at each level you can use fixed labels for that you need to
make multiple OpenDoc URL for each level and pass the variable in same manner
as explained above and open the child dashboard using the URL button & many
more ideas you can implement in your Dashboard.
Thanks
& Regards
Mayur
Patil